

For two days we’ve measured what job postings hide: the pay, then the work mode. Today, the other side. When a posting does show a number, what does it say?
First, four things these numbers are, so you know exactly what you’re looking at:
- Cash bands, not total compensation. A posted range is base salary. No equity, no bonus, no benefits. For senior roles especially, real total comp sits well above these figures.
- US postings only. The board carries international roles too, but every number below is computed on identifiably US postings, so nothing offshore drags a median around. The figures still blend every US metro and state: a national median is a benchmark’s starting point, not your city’s number.
- Annual salaries only. About 40,000 postings disclose hourly rates instead; we count them separately and never blend them into these medians.
- Live postings only. This is a snapshot of jobs you could apply to today, July 25, 2026, not a historical average.
The headline numbers
Of 677,096 live postings, 164,117 list an annual salary, and 158,219 of those are US roles. Across the US set:
- Median: $130,650
- Middle half of the market: $90,380 to $178,839 (the 25th to 75th percentile)
- Average: $142,785, comfortably above the median, because high salaries stretch further above the middle than low salaries sit below it
If you’re benchmarking an offer, that $90k-to-$179k band is more useful than any single number. Half of all disclosed US salaries land inside it.
One refinement to this week’s running theme, for the record: the 24.2% disclosure rate we’ve cited counts annual salaries only. Include the 40,689 postings that disclose an hourly rate (median $19.75, a different labor market we’ll treat properly another day) and about 30% of postings show some usable number. The strictest measure of transparency, an annual figure you can compare, remains 1 in 4, and 7 in 10 postings still show nothing at all.
The remote premium is real, and it’s 26%
Among postings that list an annual salary, pay sorts cleanly by stated work mode:
| Stated work mode | Postings with salary | Median salary |
|---|---|---|
| Remote | 23,873 | $150,000 |
| Hybrid | 36,849 | $142,400 |
| No work mode stated | 56,271 | $123,635 |
| Onsite | 41,226 | $118,797 |
The median remote posting pays 26% more than the median onsite posting. Some of that is composition (remote skews toward software and other high-paying fields), but the pattern is too large to be an artifact.
Crossover with this week's data
Notice the “no work mode stated” row landing near the bottom again. Yesterday we showed those postings are also the least likely to disclose pay at all: 17.5%, versus 40.3% for hybrid. Transparency and pay travel together, and vagueness keeps discounting the same postings.
The ladder, priced
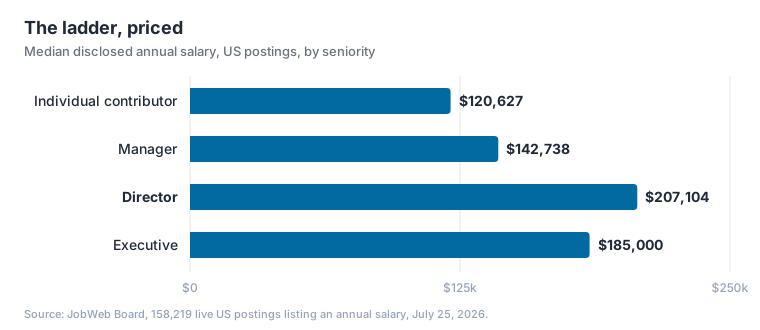
The steps are roughly $22,000 from individual contributor to manager and $64,000 from manager to director. Then the executive median drops to $185,000.
That dip echoes the disclosure inversion from day one. The “executive” bucket is mostly VP-level roles, true C-suite compensation is negotiated privately and rarely posted, and remember these are cash bands: the layer where equity and bonus dominate total comp is exactly the layer where a posted base range says the least. The market above director doesn’t post its prices. It never has.
Same rung, different ladder
A single national ladder hides the bigger truth: the same seniority pays wildly differently depending on the function. Here’s an example across some departments:
| Function | IC median | Manager median |
|---|---|---|
| Engineering | $161,418 | $194,000 |
| Marketing | $135,000 | $150,000 |
| Healthcare & Clinical | $106,310 | $123,424 |
| Finance & Accounting | $100,000 | $147,500 |
| Sales | $97,500 | $137,050 |
An engineering IC’s median sits $61,000 above a finance IC’s. An engineering individual contributor out-medians a finance manager by $14,000. And note the sales pattern: the lowest IC base in the table ($97,500, because commission lives outside the base band) with a steep jump to management.
So when you benchmark, benchmark inside your function. The $130,530 overall median is the market’s center of gravity, not your role’s.
What to do with this
- Benchmark before you talk numbers. Find your function and level above, then remember it’s a national blend of base bands: adjust up for your metro and for total comp.
- Filter to postings that respect you. JobWeb Board lets you set a salary floor and search only postings that disclose, free, no account needed.
- Make pay a criterion. Fitcheck checks every job that reaches you against the salary range you set and classifies each as Apply, Review, or Skip with the reasons shown, so a posting below your floor never costs you an evening.
How we counted
Snapshot of live postings on JobWeb Board taken July 25, 2026, sourced directly from employer applicant tracking systems and government job boards. Live postings only; closed postings are excluded. Salary figures are USD annual base ranges represented by their midpoints, computed on identifiably US postings only. Hourly disclosures are counted separately and never blended into these medians. Seniority and function are classified from job titles. As a robustness check, we ran the same analysis on the more than 100,000 US roles that have already closed: their median came in within 0.3% of the live number. Numbers drift daily; the ratios have been stable across recent snapshots.
Tomorrow: how long job postings actually live. And later in the series: the industries that hide pay the most, and why the biggest employers are the quietest.